From Bitcoin to Binance Coin and even Ethereum, cryptocurrencies are one of the most exciting investments of our time.
With their extraordinary rates of return and accessibility, it looks as if just about everyone is getting in on the crypto rush.
However, that’s not all there is to crypto. As these assets are decentralized and totally unregulated, their price movements are extremely volatile.
Because of this, investors have to be on their feet 24/7 and ready for anything. This is why it’s important to have all of your data charted in a single, easy-to-read format.
And so, enter the crypto chart.
What Are Crypto Charts?
Simply put, a crypto chart is a sheet that visually displays information related to a crypto asset. For centuries, charts have been used by academics and investors to track information related to their chosen asset.
Information such as rates of return and price are most commonly displayed and measured against time on a crypto chart.
Types Of Crypto Charts
There are many different types of crypto charts that you can use, but investors usually use either bar graphs or line graphs.
Crypto charts usually take the form of bar or line graphs and plot data such as rate of return or price against time.
As the data is plotted on the chart, viewers will be able to observe how the rates of return/price move with time.
Bar Charts
Bar charts or bar graphs are used to display indices that are independent to one another, making them ideal for comparing the performance of one crypto asset against another.
For example, a bar graph can be used to compare the rates of return of Ethereum, Bitcoin, Ripple XRP, Litecoin, and other crypto assets over time. Thus making it possible for an investor to identify high and low performing assets.
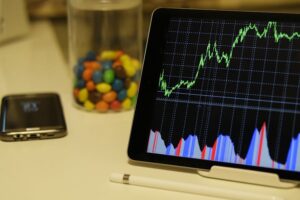
Line Charts
Line graphs are great for charting changes in an asset’s price or rate of return over time. Also known as line charts, they let you spot trends and make predictions on price movements of crypto assets.
That way, you’ll be able to plan out your investing strategy and decide on the next course of action.
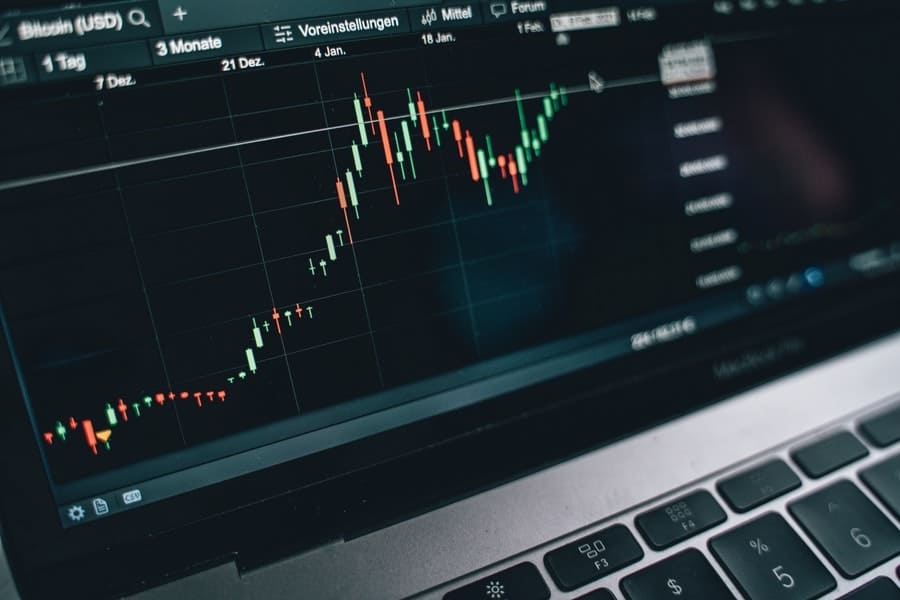
Candlestick Charts
As any seasoned investor will tell you, trading is often heavily influenced by emotions. Because of this, price fluctuations occur on a daily basis. And in order to track these price fluctuations, traders make use of candlestick charts.
Candlestick charts combine the capabilities of a bar chart and line chart in a single, easy-to-understand presentation.
Candlestick charts first originated in Japan during the 18th century, when Japanese rice merchant Munehisa Homma used it to track the price of rice futures in the market.
These charts let you track the opening and closing prices of an asset along with the day’s highest and lowest prices. From here, an investor can forecast short-term price movements and come to a course of action.
Why Are Crypto Charts Important?
Crypto charts usually take the form of a graph and are presented in a rate of return or price against time format. As the data is plotted on the chart, viewers will be able to observe how the rates of return/price move with time.
A crypto chart allows you to track all information related to your asset. While some investors tend to rely on their “gut instinct” or intuition, crypto charts give you a much more objective view of the situation.
They allow an investor to determine how external events have affected asset prices in the past. And from here, use this information to conduct technical analysis and take up a position that will be profitable to them.
How Do You Use Crypto Charts?
So, as you can see, crypto charts have a variety of uses. From comparing the performance of crypto assets to tracking price movements, it’s clear that charts are a vital tool for any investor.
Dow Theory
But to make sense of your crypto chart, you first need to understand the basics of Dow theory Developed by Charles H. Dow, Dow theory highlights forms the foundation of technical analysis, and is essential if you want to make sense of crypto charts.
While Dow theory was originally modelled on the stock market, it can still be used for making sense of crypto charts.
The 6 tenets of Dow theory are:
- The market will always act on all available information
Dow theory assumes that market participants will make decisions based on all available information, and this will be reflected in changes in asset prices.
We can assume that factors such as government regulation, economic outlook, and new releases will all have an effect on price movements.
- There are 3 trends in every market
Shifts in asset prices are known as “movements” and they can be classified as:
- Primary movements. Major bullish or bearish trends that may last for months or even years.
- Secondary/intermediate movements. Also known as medium swings, these are medium-term price shifts that last for several days or months.
- Minor movement. Short-term market speculations, i.e., price shifts that last for days or hours.
- Movements will continue until they are ended
Under Dow theory, it is assumed that a market movement will continue until data indicates otherwise.
- Trading volumes must reflect primary movements
For example, if the primary market movement indicates that Bitcoin prices are showing a bullish pattern, trading volume of Bitcoin should indicate so.
If this does not occur, it could indicate that your information is inaccurate or a reversal is imminent.
- Every primary trend has 3 phases
Dow theory stipulates that every primary trend has 3 phases, which are classified as:
- Accumulation phase. Here, informed investors start buying/selling assets depending on the primary trend i.e. bearish or bullish movements.
- Public participation phase. This phase is when the largest price movements occur when a larger number of investors begin jumping on the bandwagon.
- Distribution phase. And finally, distribution. During this phase, informed investors begin redistributing their holdings and the rest of the market reacts in response. All this comes in the form of either panic buying (bull market) or panic selling (bear market).
- Market performances must reflect one another
In the stock market, Dow theory explains that related stocks should reflect current market conditions, i.e., if a company in a certain industry reports higher earnings, its competitors should also reflect this.
The same concept can be said for cryptocurrencies. For example, an increase in Bitcoin prices should also see the price of altcoins rise accordingly.
If you want to find the best crypto charting software click here for a complete list: https://blog.tezro.com/best-crypto-charts/
Closing thoughts
Crypto charts are not as complicated as most of us would think. They provide investors with vital information and help them make educated decisions.
If you do intend to invest in crypto, make sure that you understand the risky, volatile nature of the market.